Build a Mini Weather Station with ESP32-C3 and OLED (Beginner Guide)
This project is part of the ESP32 Smart Environmental Monitor Series, where we gradually build a complete IoT monitoring system using the ESP32-C3. Instead of jumping directly into complex networking and cloud integration, this series follows a progressive approach:
- Part 1 – Build a basic OLED temperature and humidity monitor
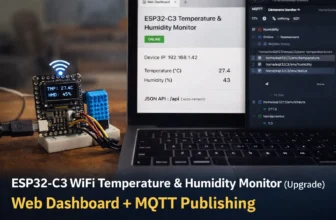
- Part 2 – Add WiFi, Web dashboard, and MQTT cloud support
- Future Parts – Add data logging, OTA updates, low-power mode, and multi-sensor expansion
Whether you’re a beginner or an intermediate developer, this series will guide you step by step from simple embedded programming to real IoT system design.
In this beginner-friendly project, you’ll learn how to build a compact real-time temperature and humidity monitor using an ESP32-C3 development board with a built-in 0.42” OLED display (SSD1306) and a DHT11 sensor. Every second, the ESP32-C3 reads the sensor and updates the OLED in a clean two-line layout.
This is a great first step into embedded development because it gives you immediate visual feedback without requiring WiFi, cloud services, or a phone app. By the end, you’ll have a tiny “mini weather station” you can place on a desk, in a workshop,or in a lab environment.
- How to wire a DHT11 sensor to the ESP32-C3 (using GPIO2)
- How the built-in OLED uses I²C (SDA=GPIO5, SCL=GPIO6)
- How to install and use the U8g2 display library
- How to read temperature/humidity with the Adafruit DHT library
- How to format text and fonts for a tiny 72×40 OLED
- How to detect sensor failures and display a helpful error message
- How to think about accuracy, update rate, and practical improvements (still beginner level)
Project Overview
The OLED displays the current temperature and humidity in a simple two-line format. The display refreshes every second:
Example Display Output
TMP: 27.4C
HMD: 43%
TMP indicates temperature in Celsius (°C), and HMD indicates relative humidity as a percentage. The labels are small, while the values are drawn in larger fonts for readability on the compact OLED.
This tutorial focuses on the core embedded workflow:
read sensor → process data → draw on display.
You’ll practice wiring, using libraries, compiling and uploading code, and debugging common issues. Once you can build this basic version reliably, you’ll be ready to add WiFi dashboards, MQTT, data logging, or low-power mode later.
Components Required
Here’s what you need to build the beginner version.
| Component | Quantity | Description |
|---|---|---|
| ESP32-C3 Board with 0.42” OLED | 1 | Microcontroller board with an integrated SSD1306 OLED (often 72×40 resolution) |
| DHT11 Sensor | 1 | Digital temperature and humidity sensor (simple, low-cost, beginner-friendly) |
| Jumper Wires | 3 | For VCC, GND, and DATA connections |
| Breadboard (optional) | 1 | Helpful for prototyping and reducing wiring mistakes |
Many DHT11s come on a small breakout board (a “module”). These modules often include the required pull-up resistor on the DATA line. If you’re using a bare DHT11 (just the sensor package), you may need to add a pull-up resistor (commonly 10kΩ) between DATA and VCC for reliable readings.
Wiring Connections
Wiring is intentionally minimal. The DHT11 has three practical connections: power, ground, and one data pin. The OLED is already integrated on the ESP32-C3 board and communicates via I²C.
DHT11 → ESP32-C3
| DHT11 Pin | ESP32-C3 Pin | Description |
|---|---|---|
| VCC | 3.3V | Power supply (recommended for ESP32 logic compatibility) |
| GND | GND | Ground (must be common with the ESP32-C3) |
| DATA | GPIO2 | Digital data pin (single-wire protocol handled by library) |
If you see “Sensor Error!” frequently, the first thing to check is wiring stability: loose jumpers are the #1 cause of DHT read failures. Shorter wires usually help.
Integrated OLED (SSD1306) I²C Pins
On this ESP32-C3 board, the built-in OLED uses I²C with:
SDA = GPIO5, SCL = GPIO6.
| OLED Pin | GPIO | Function |
|---|---|---|
| SDA | GPIO5 | I²C data |
| SCL | GPIO6 | I²C clock |
I²C is a two-wire communication bus used by many sensors and displays.
SCL is the clock line, and SDA is the data line.
Multiple devices can share the same bus, which makes it great for adding more sensors later.
Arduino IDE Setup
This project uses the Arduino IDE. If you’re new to ESP32 boards in Arduino, the workflow typically looks like this:
1) Select Board
In Arduino IDE, choose your ESP32-C3 board model from the board list. This ensures the correct compiler, flash settings, and pin definitions are used.
2) Select Port
Plug in the board and choose the correct serial port (COM / tty). If upload fails, the wrong port is a common cause.
3) Upload Sketch
Compile and upload the code. The first build may take longer as libraries are compiled. Once uploaded, the OLED should begin updating every second.
If your ESP32-C3 won’t upload, try pressing and holding the BOOT button (if your board has one) during upload, then release when the upload starts. Some ESP32-C3 boards require this depending on their boot configuration.
Libraries Required
Install these libraries in Arduino IDE:
Sketch → Include Library → Manage Libraries…
U8g2 (by olikraus)
A popular graphics library for monochrome displays (SSD1306 included). It supports many fonts, layouts, and drawing primitives.
DHT sensor library (Adafruit)
Provides convenient functions to read temperature and humidity from DHT sensors without manually managing timing.
Adafruit Unified Sensor
A shared dependency used by many Adafruit sensor libraries, including DHT. Install it to avoid compile errors.
Libraries save you from writing low-level driver code. For a beginner project, this is ideal:
you can focus on wiring, logic, and output formatting while using proven, community-tested code for sensor and display drivers.
Arduino Code
Below is the complete beginner sketch. It reads temperature and humidity and displays them on the OLED. It also includes basic error handling: if the sensor returns invalid values, you’ll see a clear message on the screen.
#include <Arduino.h>
#include <U8g2lib.h>
#include <Wire.h>
#include <DHT.h>#define SDA_PIN 5
#define SCL_PIN 6U8G2_SSD1306_72X40_ER_F_HW_I2C u8g2(
U8G2_R0,
/* reset=*/ U8X8_PIN_NONE,
SCL_PIN,
SDA_PIN
);#define DHTPIN 2
#define DHTTYPE DHT11
DHT dht(DHTPIN, DHTTYPE);void setup() {
Wire.begin(SDA_PIN, SCL_PIN);
u8g2.begin();
dht.begin();
}void loop() {
float h = dht.readHumidity();
float t = dht.readTemperature();if (isnan(h) || isnan(t)) {
u8g2.clearBuffer();
u8g2.setFont(u8g2_font_ncenB08_tr);
u8g2.drawStr(5, 20, “Sensor Error!”);
u8g2.sendBuffer();
delay(1000);
return;
}u8g2.clearBuffer();
u8g2.setFont(u8g2_font_ncenB08_tr);
u8g2.drawStr(0, 15, “TMP:”);u8g2.setFont(u8g2_font_fub11_tr);
u8g2.setCursor(40, 15);
u8g2.print(t, 1);
u8g2.print(“C”);u8g2.setFont(u8g2_font_ncenB08_tr);
u8g2.drawStr(0, 35, “HMD:”);u8g2.setFont(u8g2_font_fub11_tr);
u8g2.setCursor(40, 35);
u8g2.print(h, 0);
u8g2.print(“%”);u8g2.sendBuffer();
delay(1000);
}
The OLED is small, so layout matters. This sketch uses:
a smaller font for labels (“TMP:” and “HMD:”) and a larger font for numeric values. This improves readability without requiring scrolling or pages.
How It Works (A Beginner-Friendly Deep Dive)
Let’s break the project into three simple stages: sensor reading, data validation, and display rendering. Understanding these stages will help you debug issues and also make upgrades later (like WiFi dashboards or data logging).
1) Reading the DHT11
The DHT11 provides two measurements: temperature (in °C) and relative humidity (in %). With the Adafruit library, reading is straightforward:
dht.readTemperature()returns temperature (Celsius by default)dht.readHumidity()returns relative humidity (%)
Behind the scenes, the library handles the sensor’s timing-sensitive protocol. As a beginner, you don’t need to implement the protocol yourself—just call these functions.
2) Validating readings (NaN check)
Sometimes the sensor read fails due to wiring, power noise, or timing issues. When this happens, the library may return NaN (“Not a Number”). This is why the sketch checks:
if (isnan(h) || isnan(t)) { ... }This defensive check prevents the OLED from showing nonsense values. Instead, you see a clear “Sensor Error!” message, which is much easier to diagnose.
3) Rendering to the OLED with U8g2
U8g2 uses a “draw to buffer → send to screen” model:
clearBuffer()clears the internal frame buffer- Draw operations (text, lines, pixels) update the buffer
sendBuffer()pushes the final buffer to the OLED
This makes the display stable and reduces flicker because the OLED updates with a complete frame rather than partial updates. It also makes it easier to build consistent layouts: you draw everything for one frame, then present it.
The DHT11 is designed for relatively slow sampling. A one-second refresh is simple, stable, and beginner-friendly. If you read too frequently, you may see unreliable values or more frequent “Sensor Error!” messages.
Display Layout Choices
On a tiny OLED, layout is everything. This project uses a simple format that stays readable:
Clean labels
Labels (“TMP:” and “HMD:”) are short and consistent. This keeps the UI minimal and prevents text clipping.
Large values
The numeric readings use a larger font so you can read them from a distance. This matters more than fancy graphics for a practical monitor.
If you want to make the UI feel more “finished,” you can add a small degree symbol (°) and format units consistently, or add a third line for status text like “OK” / “ERR”. Keep it simple at first: readability beats complexity.
About the DHT11: Accuracy and Expectations
The DHT11 is popular because it’s cheap and easy to use, but it has limitations. It’s perfect for learning, prototyping, and rough environmental checks—just don’t expect lab-grade precision.
| Category | What to Expect |
|---|---|
| Stability | May fluctuate slightly between readings, especially with airflow or temperature changes |
| Accuracy | Good enough for basic monitoring, but not ideal for precision measurement |
| Update speed | Designed for slow updates; 1–2 seconds is a safe interval |
If you later want better accuracy and stability, consider switching to a DHT22 or an I²C sensor like AHT20 or
SHT30. The rest of the project structure (read sensor → display) stays the same, which makes upgrades easy.
Applications
Even in its beginner form, this project has real-world usefulness. Here are a few practical scenarios where a compact OLED monitor is handy:
Mini desk weather display
Put it near your workstation for quick indoor temperature/humidity checks—especially helpful during dry seasons.
Workshop / lab monitor
Keep an eye on humidity in a workspace to protect materials, tools, or electronics from moisture extremes.
IoT prototype front panel
Use this OLED layout as a “front panel” for a future IoT device—even if you later add WiFi and cloud dashboards.
Even if you later add WiFi, having local OLED output is extremely useful for setup, debugging, and quick checks. It also makes your project feel like a standalone device rather than “just a sensor on a board.”
Troubleshooting (Step-by-Step)
If something doesn’t work on the first try, don’t worry—that’s normal. Use the checklist below to diagnose problems quickly. Most issues come from wiring mistakes, missing libraries, or incorrect board selection.
The OLED is blank. What should I check first?
Start with the basics:
(1) Confirm your ESP32-C3 board actually has the integrated OLED.
(2) Confirm the I²C pins match your board wiring (this tutorial uses SDA=GPIO5, SCL=GPIO6).
(3) Make sure Wire.begin(SDA_PIN, SCL_PIN) runs before u8g2.begin().
If the display remains blank, re-check that the correct U8g2 constructor is used for your OLED type/resolution.
The display shows “Sensor Error!” continuously.
That means the sensor returned invalid values (NaN). Check:
(1) DHT11 wiring: VCC→3.3V, GND→GND, DATA→GPIO2.
(2) If using a bare DHT11, add a pull-up resistor (commonly 10kΩ) between DATA and VCC.
(3) Use shorter jumper wires.
(4) Try a different DHT11 module if you suspect a faulty sensor.
My values jump around. Is that normal?
Small fluctuations are normal, especially with the DHT11. Airflow, warm hands near the sensor, and nearby heat sources can affect readings. If you want smoother output without adding complexity, increase the interval to 2 seconds or apply a simple averaging method later.
Compilation fails with missing headers or library errors.
Ensure you installed all required libraries: U8g2, DHT sensor library (Adafruit), and Adafruit Unified Sensor. Also confirm you selected an ESP32-C3 board in Arduino IDE. A wrong board selection can trigger unexpected compile problems.
Debug one layer at a time:
Power (3.3V & GND) → Wiring (DATA pin correct?) → Libraries (installed?) →
Board settings (correct board/port?) → Code (uploaded successfully?).
This approach saves a lot of time.
Simple Improvements You Can Try (A + B + C, Still Beginner)
The beginner version is intentionally minimal, but you can still make small improvements without turning this into an advanced IoT project.
Here are a few optional tweaks that help you learn more while keeping the firmware understandable.
A) Step-by-step usability improvements
- Add a short boot screen like “Starting…” for 1 second.
- Show a sensor status line (“OK” / “ERR”).
- Print values to Serial Monitor as well as OLED for easier debugging.
These are small UX upgrades that teach you how to communicate device state to users (or to yourself while testing).
B) Deeper understanding improvements
- Change refresh interval to 2 seconds and compare stability.
- Try different fonts to learn how text size affects layout.
- Experiment with drawing a simple border using U8g2 drawing functions.
These experiments help you understand both sensor behavior and display rendering without needing complex networking.
C) Practical expansion ideas (still beginner-friendly)
Once this project works reliably, you can expand it in logical steps:
- Swap DHT11 to DHT22 for better accuracy (minimal code changes).
- Add a second sensor on I²C later (e.g., a light sensor) and show it on the same OLED.
- Use a simple enclosure (even a cardboard prototype) to make it a “real device.”
The key idea: get a stable baseline first, then upgrade one feature at a time.
Summary Table
| Feature | Description |
|---|---|
| MCU | ESP32-C3 |
| Sensor | DHT11 (temperature + humidity) |
| Display | 0.42” OLED (SSD1306, typically 72×40) |
| Interface | I²C (SDA=GPIO5, SCL=GPIO6) |
| Update Rate | 1 second |
| Power Supply | 3.3V |
Final Thoughts
The ESP32-C3 OLED Temperature and Humidity Monitor with DHT11 is a perfect beginner project because it combines three core skills:
wiring a sensor, using libraries, and presenting real-time data on a display. The OLED makes your project feel like a real device, and the “Sensor Error!” message gives you a simple but practical troubleshooting workflow.
If you want to keep learning after this beginner tutorial, the natural next step is to build an upgrade version:
keep the same OLED layout, but add WiFi connectivity, a small web dashboard, and optional MQTT publishing. That’s how many real IoT devices evolve: start simple, then add connectivity when the hardware foundation is stable.
Part 2 (Upgrade Version): ESP32-C3 WiFi dashboard + MQTT publishing (same OLED, same sensor, more capabilities).